About
- Daniele Mazzuoli
- I have been in the markets as an independent trader since 2003. I use various profitable strategies based on technical analysis, cyclical analysis and financial analysis. My training has been enhanced by obtaining a degree in the economics of financial markets, attending various courses, a trainee-ship with industry professionals, as well as the study of several fundamental books on financial markets. I would like to emphasize my almost total dedication to this activity. The continuous strive for improvement, in order to be more uniform and connected to the market, makes this work one of my greatest passions. I strongly believe that recognizing and understanding "the sense of timing" is a great skill for a trader. Any asset that is subject to supply and demand at least from a buyer and a seller, who act with a common interest “undermined" by psychological behavior. A trading system seeks “to eliminate” the dangerous human psychology component.
Thursday, 18 July 2013
Tuesday, 16 July 2013
Wednesday, 10 July 2013
XauUsd Daily
The gold is testing the resistance level in area 1.260$. The upward breaking could lead it around area 1.320$.
Tuesday, 9 July 2013
Friday, 5 July 2013
Ftse Mib T+3 - 30min
The starting of the Tracy, T+1 and T+2 could indicate an important confirms for a probably new T+3.
The price oscillator is going to generate the signs crossing the zero level.
So we could consider the starting of the new T+3 from the pivot low around 14988.
A few days ago I said probably first target could be around descending trend-line in area 16600 and this it could represent the first wedge of T+3.
Thursday, 4 July 2013
Wednesday, 3 July 2013
Monday, 1 July 2013
Ftse MIb - 30 min T+3
The velo of T+3 is around the 0 level. This is an important sign because it could indicate the deceleration of the last downward trend of T+3. This could mean imply an interesting moment for the begin of a new "intermediate cycle".
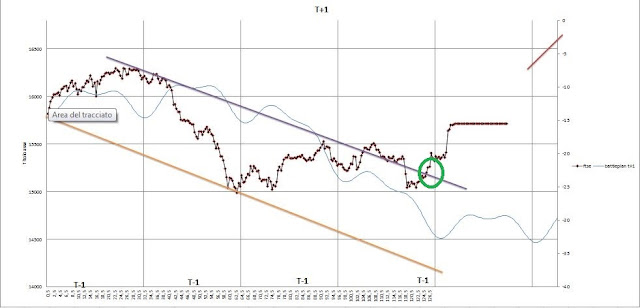
In previous charts of the tracy, t+1 and t+2, we can notice the setting about their cycle. They are in position of closing their own cycle. We can see for example that the tracy is missing about two t-2 to end, or the t+1 missing one t-1 and the t+2 missing last weekly.
It is very interesting to observe how these cycles have aligned in forecast for the probable start of a new T+3.
The upward trend breaking for each channel could be the confirm that a new cycle has started.
First target about new T+3 could be around area 16700, but is too soon to say that...I suggest to wait at least the end of this last tracy for realize how the situation could change.
Subscribe to:
Posts (Atom)


