
Friday, 28 June 2013
Thursday, 27 June 2013
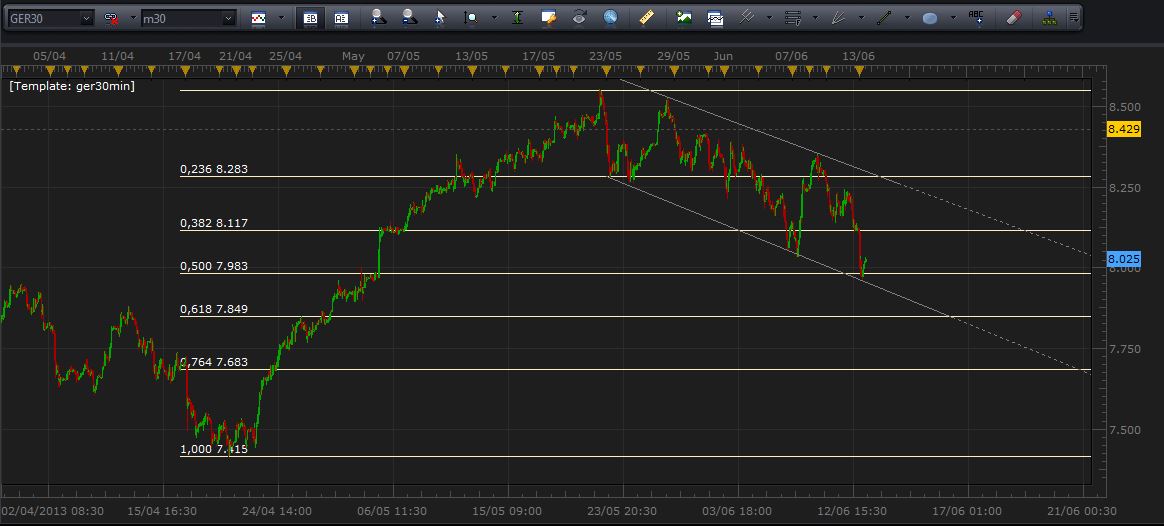
Dax - daily

Dax is rebounding from the upwards trend line, first target could be around 8150, on the last descending trend-line, drawn from top pivot in area 8.550.
Wednesday, 26 June 2013
Ftse MIb - 30min Tracy

The new Tracy has started from pivot low around 14988. The cycle setting is positive.
Tuesday, 25 June 2013
XAU/USD - weekly

For the long term, I drawn some lines of technical analysis about Gold. The commodity seems directed in a kind of downwards channel with a target to the first support level around 1.165,00. In case of pullback only the breaking of the upwards trend lines could be changing the trend.

Thursday, 20 June 2013


Monday, 17 June 2013
Ftse MIb - 30min
Dax - 30min

Dax has been falling in a perfect channel. After it has fallen down to the lower border of the channel, it has bounced and at the moment it is going to test the channel line-up...
Friday, 14 June 2013
UsdJpy - daily

..so it seems that the trend is changing..... The downwards breaking of the pivot low could be a clear confirm of the BWA.

Thursday, 13 June 2013
Ftse Mib 30 min

The price oscillator above the zero value is signs of the new tracy cycle.
At the moment the price is below 16136 and this could be probably another negative tracy.
Ftse MIb daily

I think that the annual cycle started at the low pivot point around 12500 on July 2012. The cycle closed two T+3 so far and now is going to close the third, the moving averages can confirm this.
Probably the Ftse Mib is going to test the MA at 330 periods (the black one) around 15500.
In my opinion it is very important to respect this MA because if the price breaks down the moving average it could be a sign of a prolonged bear market.
Wednesday, 12 June 2013
USDJPY daily

Just for watching...the pattern seems to be a Broadening Wedges Ascending but in my opinion missing some confirms. A further step could be the break-down of the pivot low (red line).
Tuesday, 11 June 2013
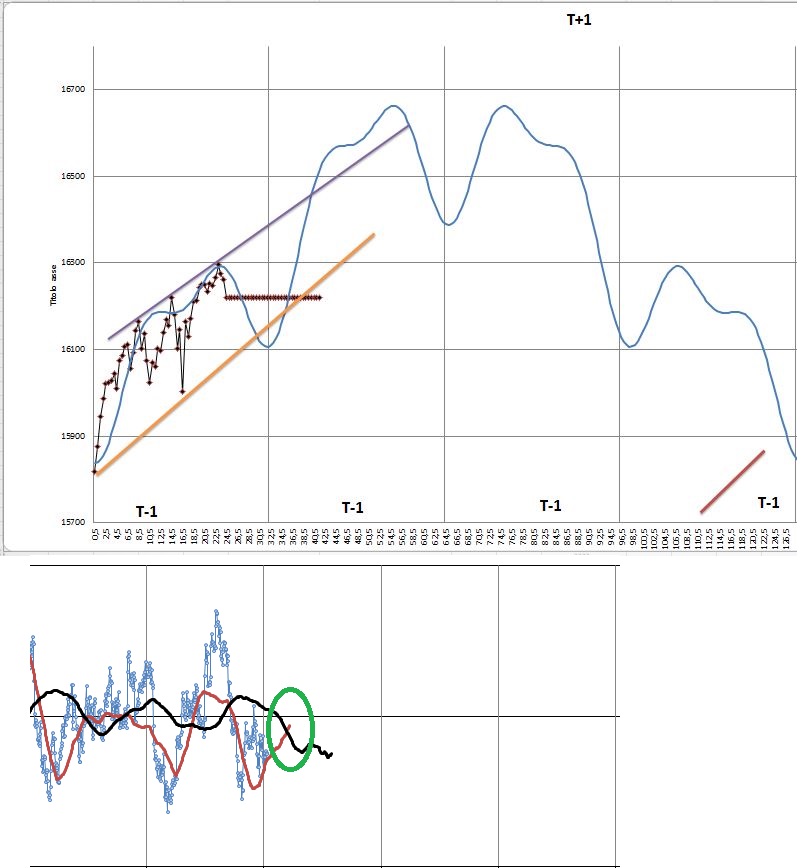
Ftse Mib 30 min - Tracy

Breaking this channel upwards will present a good sign about new cycle.
Moreover the velocity is around zero value and the price oscillator is crossing its average.

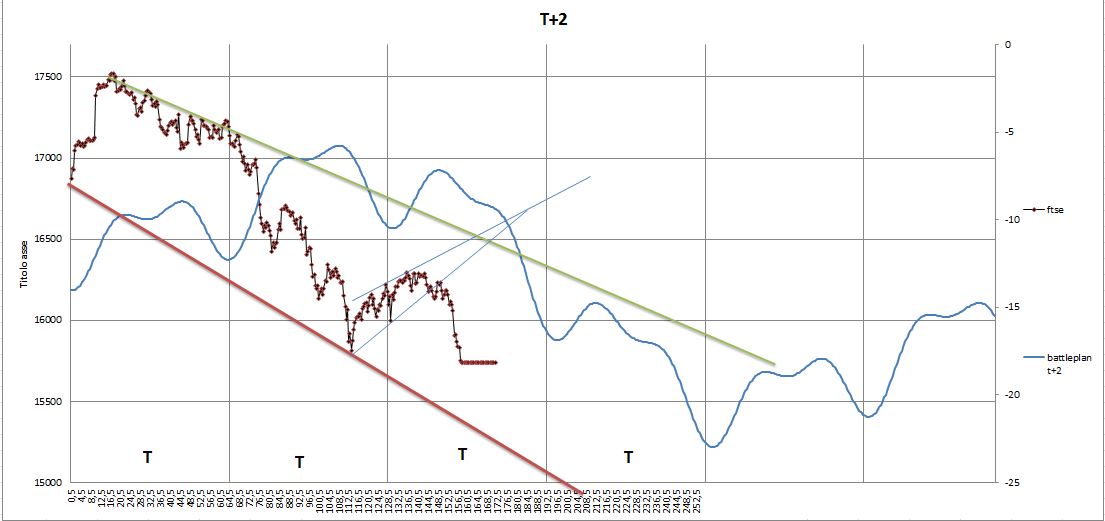
Ftse Mib t+3 - 30min

The final phase has started on the intermediate cycle after the break-down below of the important 16900 support level.

In this moment Ftse Mib respects and is testing the ascending trend line of the T+3.
On a further break-down below ascending trend line, continued bearishness could move price towards first key potential support around 16000.

The final phase of T+3 is confirmed by price oscillator through the average velocity.
Thursday, 6 June 2013
Ftse Mib 30 min

Ftse Mib has broken support at 16846 and this is a bearish signs. Probably the trend line level will be next target.

EurUsd daily

Failures of head-and-shoulders formations are rare, but they do occur.
In this case the pattern fails when the price is above the right shoulder's peak.
Wednesday, 5 June 2013
Ftse Mib 30min

The sign of the price oscillator through the velo says that the new tracy has started.
The close price below the starting value of cycle, probably, confirms a negative tracy.


Tuesday, 4 June 2013
Ftse Mib 30min

The starting of the newTracy is confirmed by price above the down trend-line.
Us30 30min

We have to wait that the price closes below the confirmation line. Only at that point does the twin-peak pattern becomes a true double top.
Be prepared to short and use a stop to limit the loss in the case that the price confirms the pattern and then drops less than 5% below the breakout price before rebounding.
In my opinion, by now, the price tried a first breaking of the confirmation line and then rebounded, but the pattern is not violated yet because about 65% of the time, price will not drop to the confirmation line before making a new high.
Monday, 3 June 2013


Subscribe to:
Posts (Atom)